A three-part series
How a city's water utility
explains your data org.
Reservoirs, treatment plants, and taps map almost perfectly onto sources, pipelines, and dashboards. We use that one metaphor to teach what a data team actually does — the people, the infrastructure, and the platform that ties it together.
Choose your starting point
Each topic stands on its own. Most people complete all three over a couple of days.
-
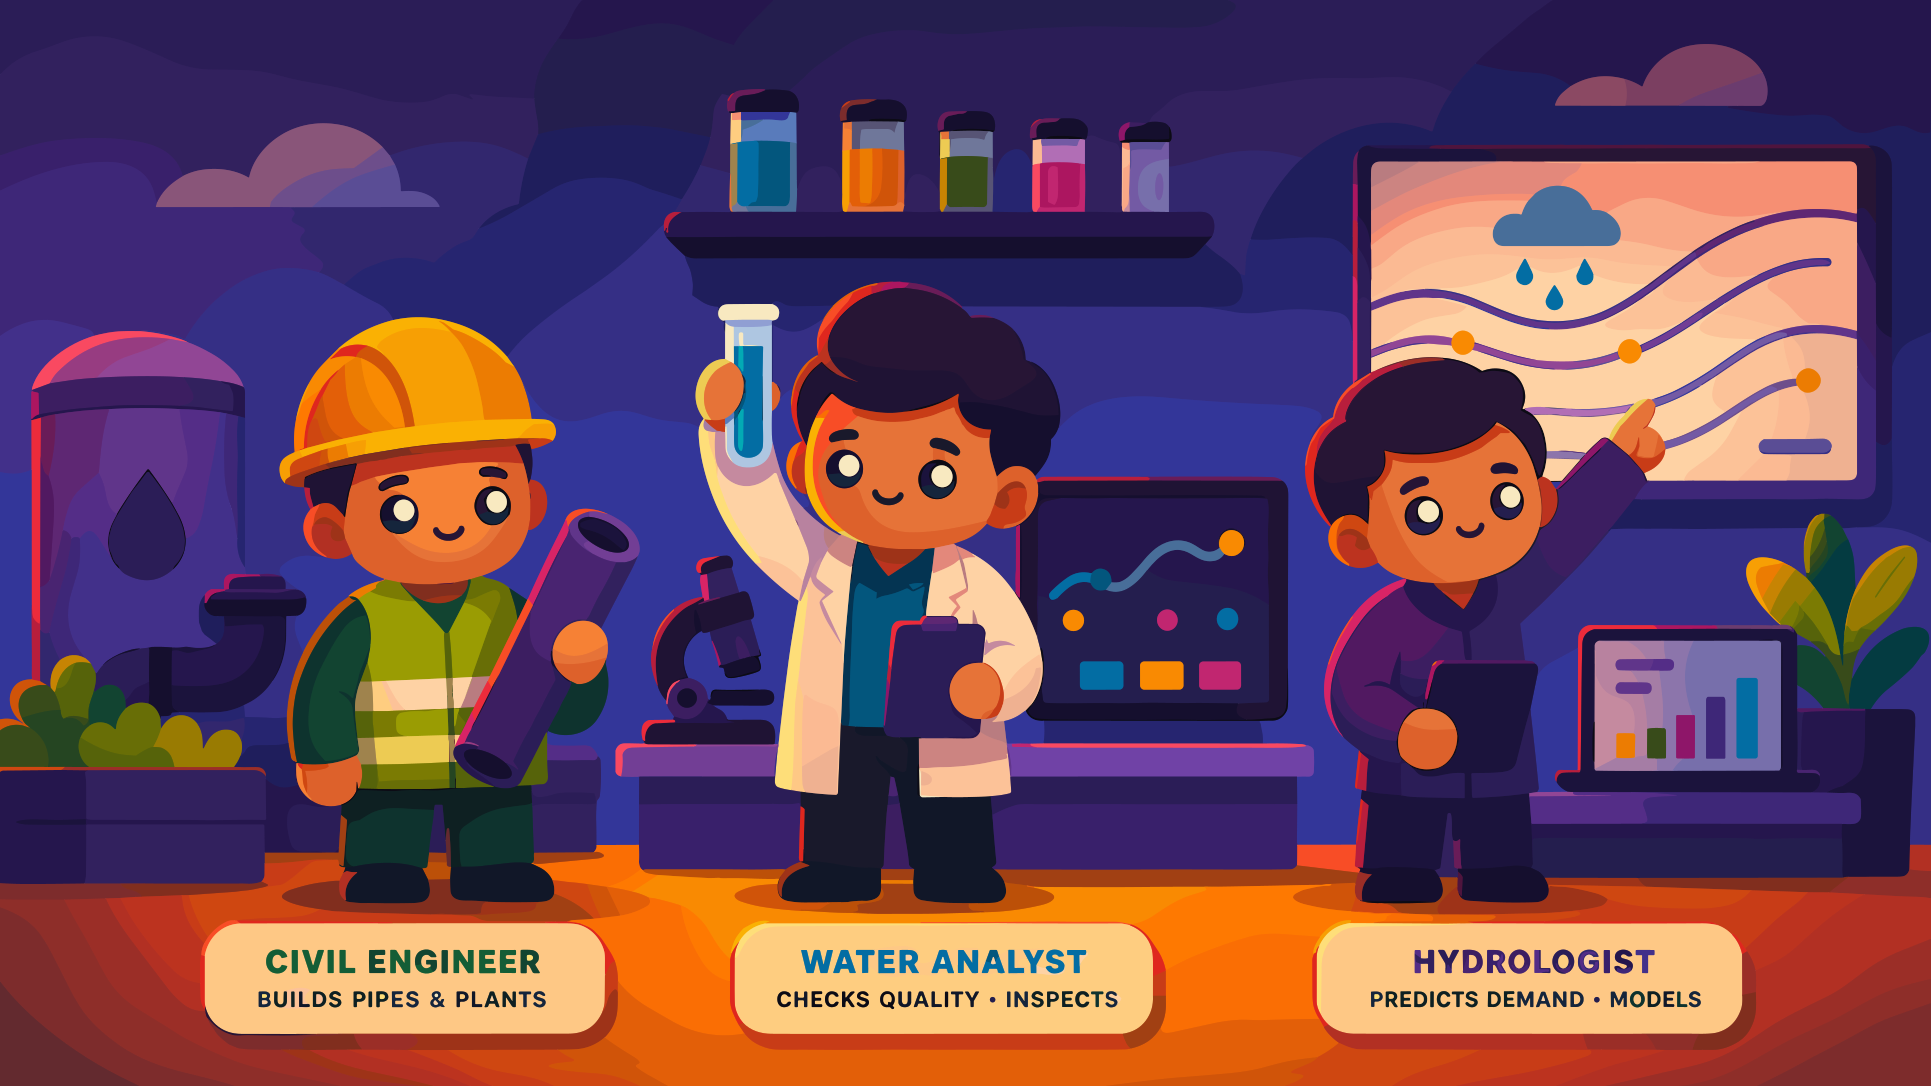 01 6 min
The People
Who runs the data utility
Three roles — engineer, analyst, scientist — and how they pass work to each other.
-
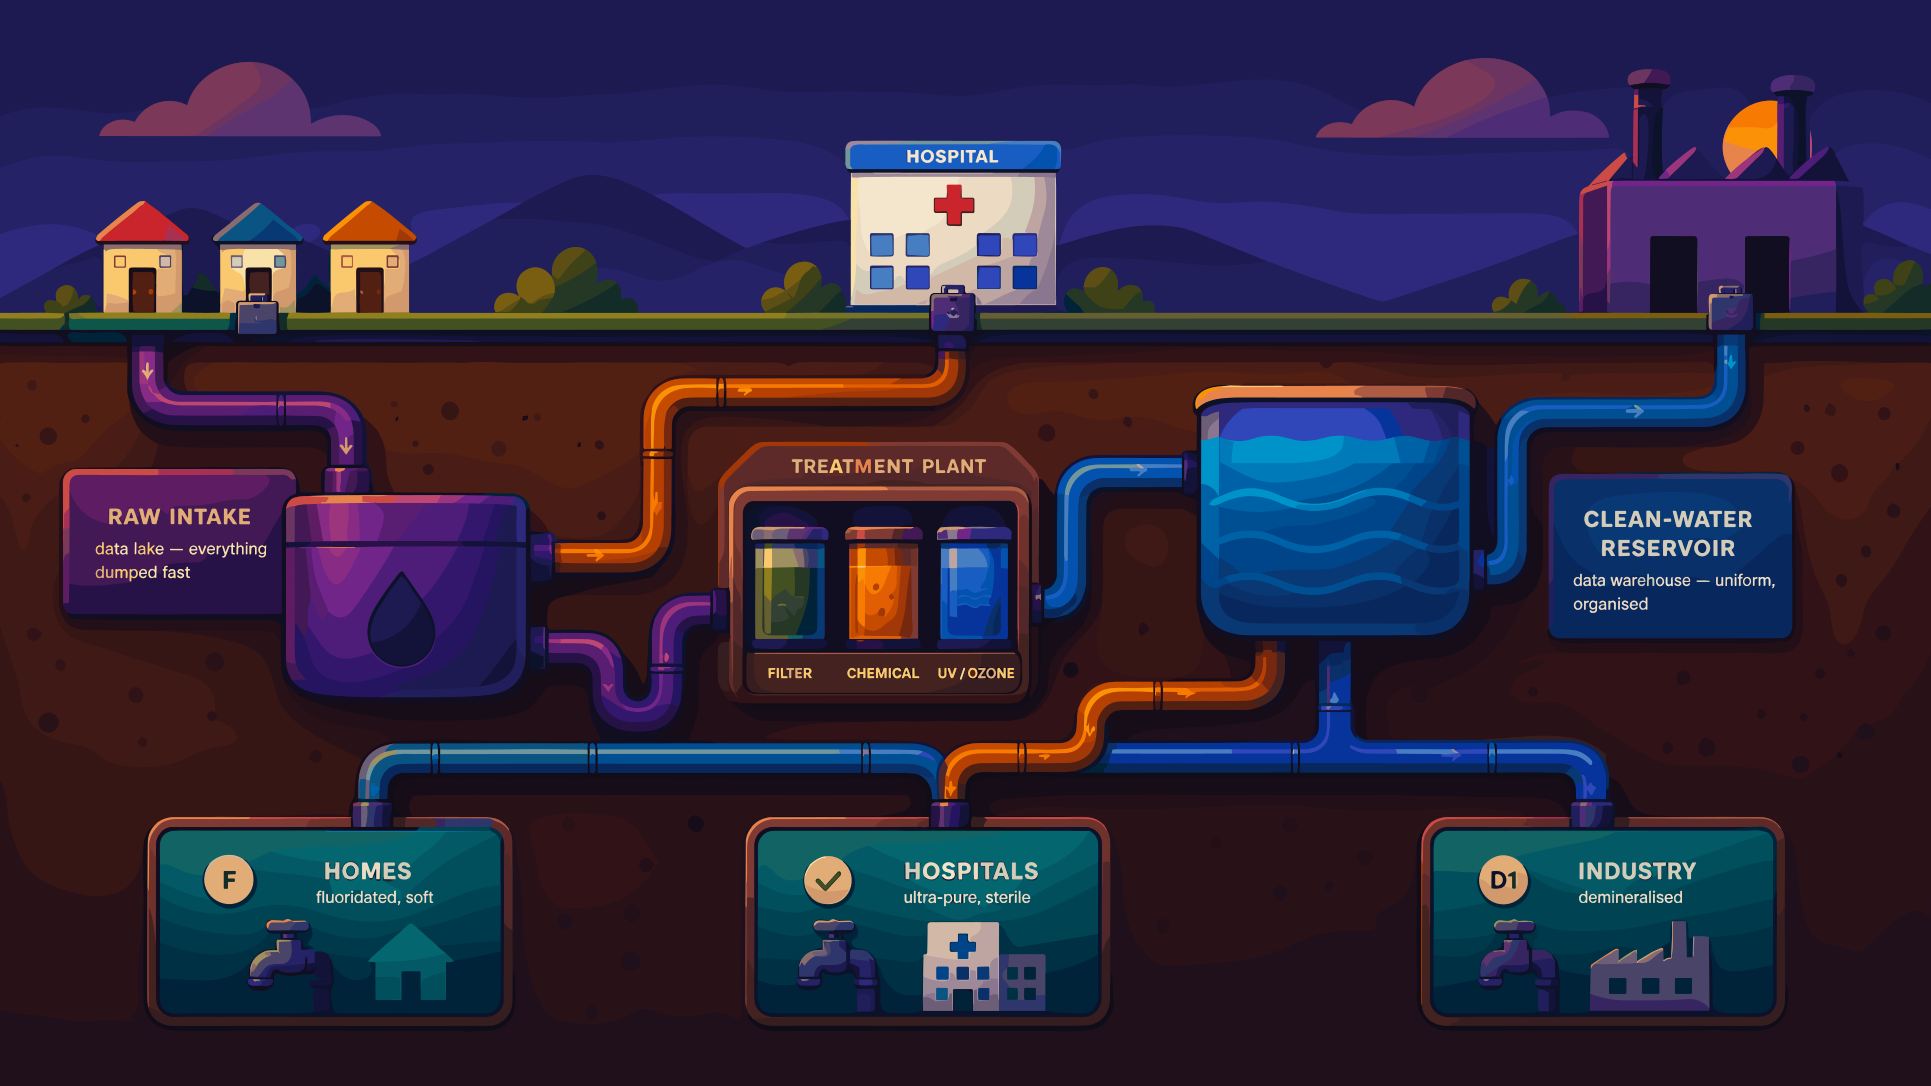 02 7 min
The Infrastructure
Behind the taps
Sources, treatment, reservoirs, distribution — the path a request actually takes.
-
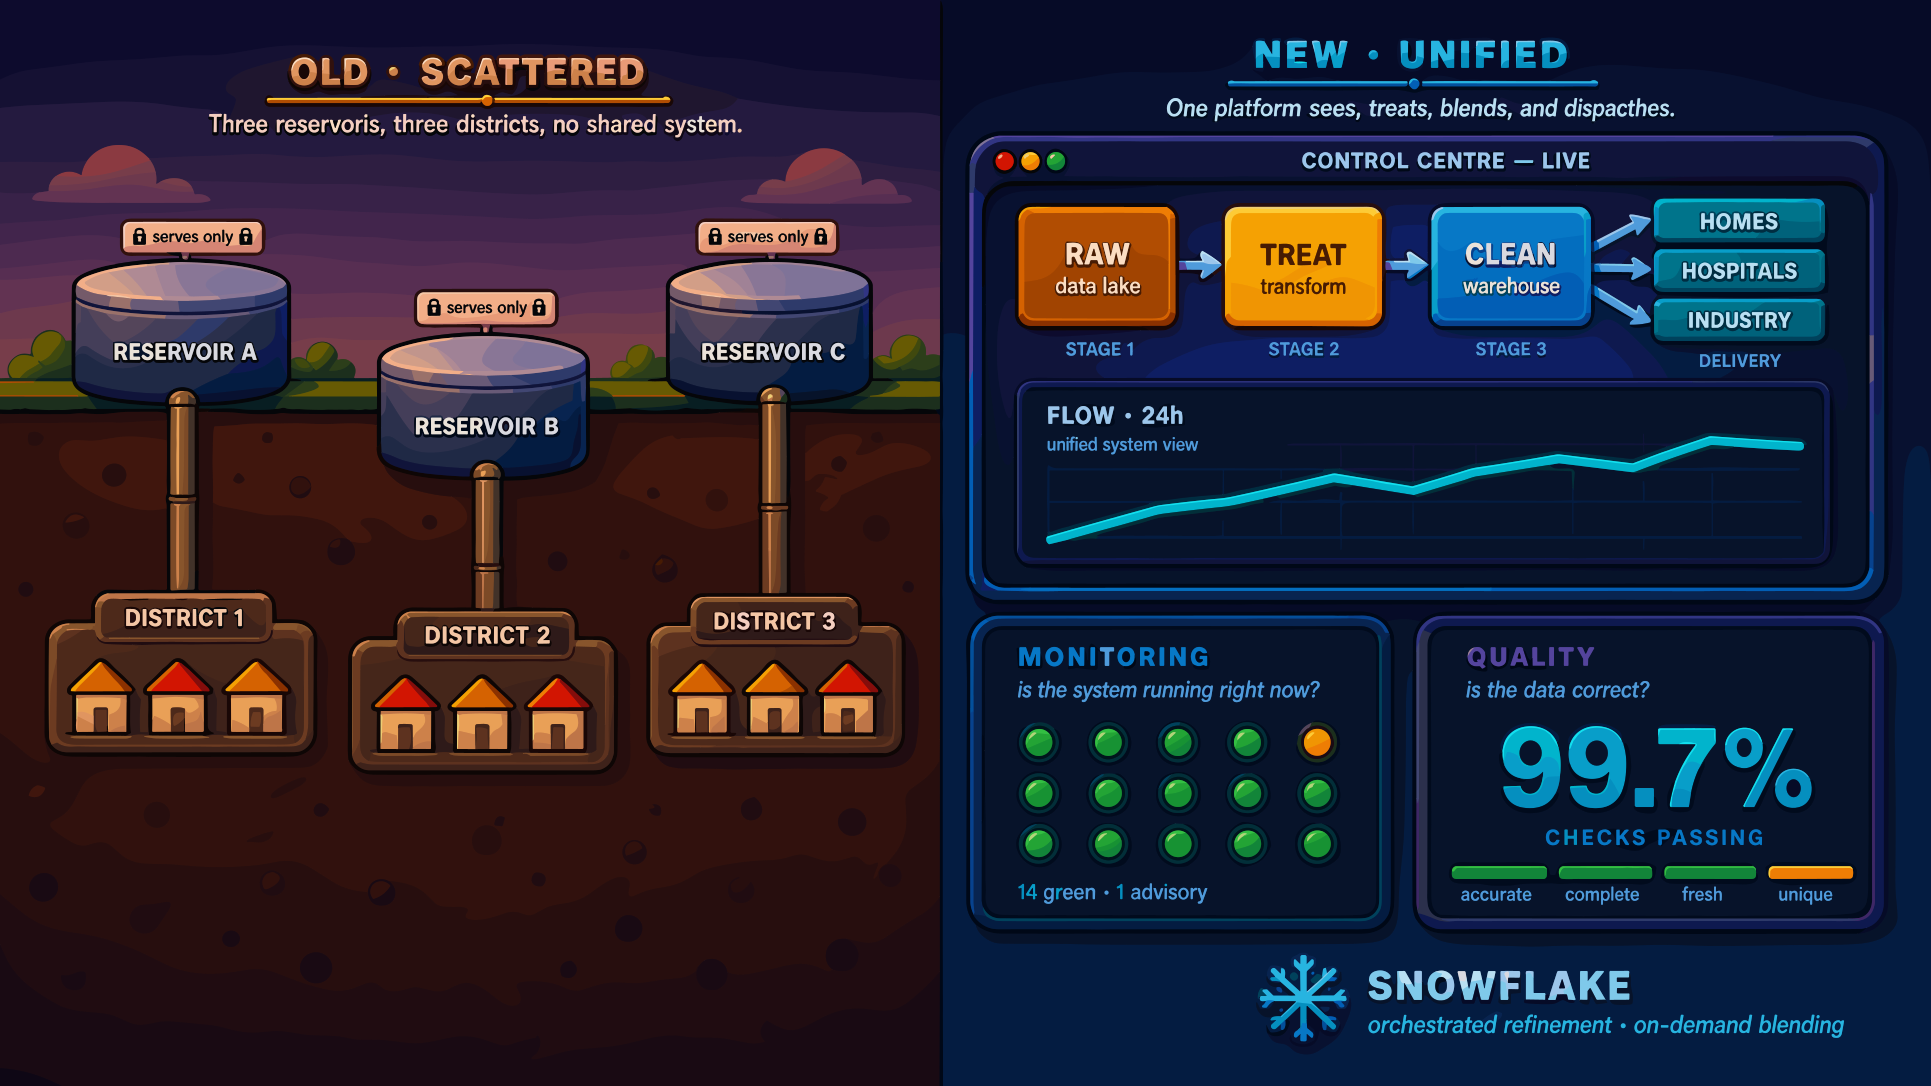 03 6 min
The Modern Utility
Why we centralised
What changed when scattered systems became one observable, governed platform.
Concrete, not abstract
Every concept lands on a thing you can see — a pipe, a reservoir, a quality dial. No flowcharts of boxes.
Built for everyone
No prior data background needed. Designers, account leads, producers, finance — this works for all of you.
Track your progress
The hub marks each topic as you finish it, so you can see what's left and pick up where you stopped.